ABSTRACT:
We describe a comprehensive system for comparative evaluation of uploaded and pre processed data in physics education research with applicability to standardized assessments for discipline based education research, especially in science, technology, mathematics, and engineering. Views are provided for inspection of aggregate statistics about student scores, comparison over time within one course, or comparison across multiple years.
The design of this system includes a search facility for retrieving anonymized data from classes similar to the uploader’s own.These visualizations include tracking of student performance on a range of standardized assessments.
These assessments can be viewed as pre and post tests with comparative statistics (e.g., normalized gain), decomposed by answer in the case of multiple choice questions, and manipulated using pre specified data transformations such as aggregation and refinement (drill down and roll up).
Furthermore, the system is designed to incorporate a scalable framework for machine learning – based analytics, including clustering and similarity based retrieval, time series prediction, and probabilistic reasoning.
SYSTEM OVERVIEW
Data Explorer:
The system (referred to throughout the paper as the Data Explorer) consists of three primary functional modules:
- Data uploading and preparation, including schema and header inference
- Information visualization, including breakdown of assessments by question and tracking student performance in courses over time (within-course or longitudinally)
- Information retrieval, comprising query interfaces and query synthesis
The Data Explorer is a data management system and federated display for educational data that provides data import, integration, interactive validation, and analytics functions. This section describes the first three components, which consist of a data intake front-end where instructors can import assessment data in a spreadsheet format.
EMERGING TECHNOLOGY
Data Import, Schema, and Header Inference:
The first approach, typified by the work of Keininger(1998,2001 ) on block segmentation, focuses on matching cells using a neighborhood based search. Because the intake process for the Data Explorer involves no optical character recognition (OCR) or handwritten character recognition (HCR), we omit layout recognition aspects of the document path and focus on schema inference from delimited files that are either already properly aligned or admit a proper alignment given a correctly inferred schema.
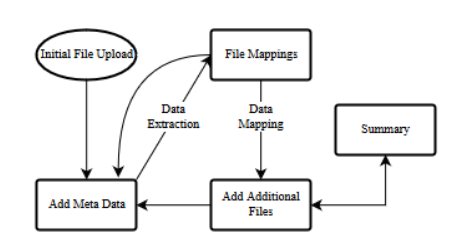
Data Flow for Importer of Data Explorer.
WORK IN PROGRESS
Information Visualization:
The information visualization facility of the Data Explorer contains a variety of functions implemented using the D3.js JavaScript library by Bostock, Ogievetsky, and Heer (2011). It how normalized (Hake) gain is plotted, with order statistics (mean and median) and standard deviation, for a class’s performance on an assessment.
It how the visualization services also allow drill-down (“breakdown”) by question, an important type of analytical query that results in the display of a distribution of answers for each question and facilitates comparative analytics for pre-and post-instructional assessments.
The objective of these visualizations is to provide instructors with actionable insight concerning: topics covered; the impact of instruction and classwork on student learning as assessed formally using tests such as FCI, FMCE, and BEMA; and longitudinal trends of concern.

Visualization of student performance on pre and post assessment, organized by classification of question. Class labels are assigned by subject matter experts.
CONTINUING WORK
Information Retrieval and Data Mining:
A further capability, designed to facilitate instructor exploration of assessment data, is that of grouping questions by known or discovered category. The results of visualizing hand-labeled categories (which are known as classesin machine learning, clustersin statistics, and segmentsin business analytics).
Work in progress aims at using unsupervised learning to perform clustering of assessment questions (by topic modeling or by other similarity-based learning). The key capability that this future work aims at is that of retrieving classes like minerelative to longitudinal data (short time series) and similarity measures adapted to such time series.
FUTURE WORK
Instructional Decision Support and Adaptive Recommendation:
A visualization of assessments across multiple courses taught at a single institution, typically by a single instructor under whose login the data are grouped for multiple semester combinations. The visualization subsystem also provides a facility for drilling down by section. This provides the analytical setting for one of our long-term objectives: to progress from interactive visualization within this federated display to adaptive decision support systems and tutoring systems.
CONCLUSION:
In this paper we have presented a data integration and information management system for STEM education research. The functionality outlined in the example screen captures is focused around our continuing research regarding schema inference and educational data mining from student assessments.
The key novel contributions with respect to data integration are intelligent systems components for schema inference where columns and other elements are unlabeled, nonstandard, and may include missing data.
The novel contribution with respect to analytics are the interactive information visualization components that both provide insights into assessment data and generate requirements for similarity based retrieval and comparative evaluation of student performance.
Source: Kansas State University
Author: Joshua Levi Weese
>> B.Com CA Final Year Projects