ABSTRACT
A novel dynamic co-simulation methodology of overall wind turbine systems is presented. This methodology combines aerodynamics, mechanism dynamics, control system dynamics, and subsystems dynamics. Aerodynamics and turbine properties were modeled in FAST (Fatigue, Aerodynamic, Structures, and Turbulence), and ADAMS (Automatic Dynamic Analysis of Mechanical Systems) performed the mechanism dynamics; control system dynamics and subsystem dynamics such as generator, pitch control system, and yaw control system were modeled and built in MATLAB/SIMULINK.
Thus, this comprehensive integration of methodology expands both the flexibility and controllability of wind turbines. The dynamic variations of blades, rotor dynamic response, and tower vibration can be performed under different inputs of wind profile, and the control strategies can be verified in the different closed loop simulation. Besides, the dynamic simulation results are compared with the measuring results of SCADA (Supervisory Control and Data Acquisition) of a 2 MW wind turbine for ensuring the novel dynamic co-simulation methodology.
SYSTEM MODEL BUILD UP
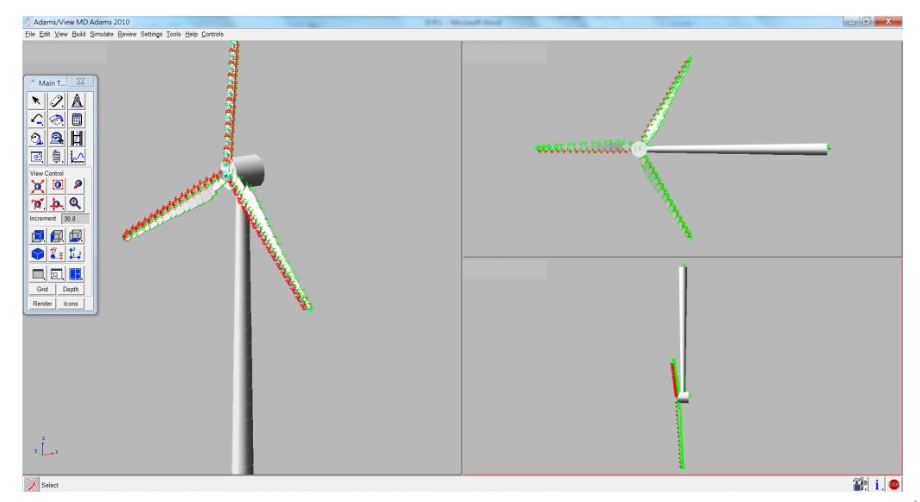
Figure 4. 3D expression of wind turbine outlook
After finishing the model mathematic setup, a geometric preference can be exported in ADAMS software with specific joints and applied aerodynamic force in Figure 4. The model is a simplified expression of components. The kinematics and dynamics are calculated in terms of Jacobian matrix and Eulerian representation.
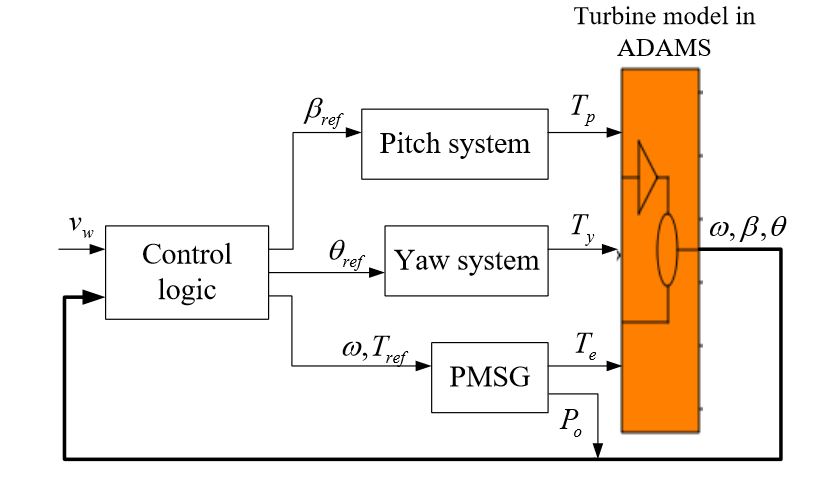
Figure 6. Block diagram of wind turbine system configuration
With the help of this comprehensive interface, the user can easily develop a user-based controller with desired subsystems. We not only can compare the subsystems with realistic supervisory control and data acquisition (SCADA), but create different control strategies when connecting to different types of generator or operating under different circumstances. The block diagram is presented as the structure of wind turbine configuration in Figure 6.
Energies 2016, 9, 6376 of 20 With the help of this comprehensive interface, the user can easily develop a user-based controller with desired subsystems. We not only can compare the subsystems with realistic supervisory control and data acquisition (SCADA), but create different control strategies when connecting to different types of generator or operating under different circumstances. The block diagram is presented as the structure of wind turbine configuration in Figure 6.
MODELING OF TURBINE SUBSYSTEM
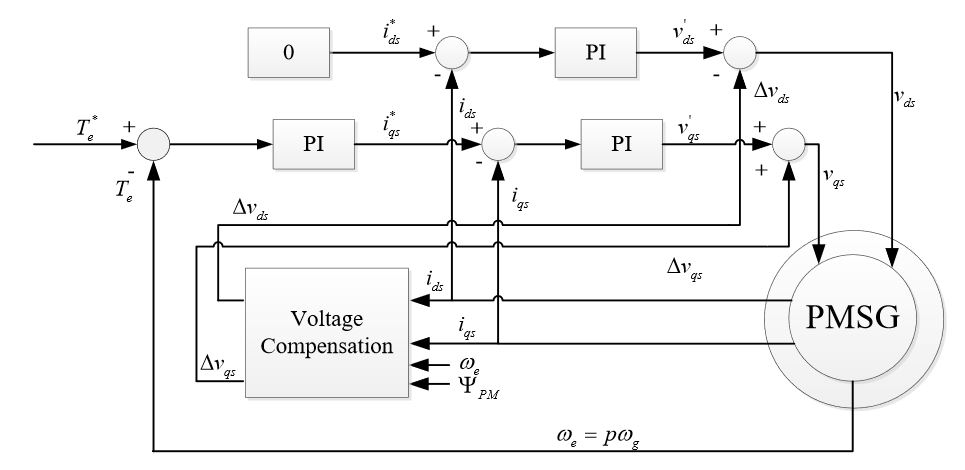
Figure 9. Block diagram of field oriented control
This type of control also puts the PMSG into high performance. In this method, the electromagnetic equations are transformed into a coordinate system with synchronous rotation and permanent magnet flux. Besides, FOC allows separate and indirect control of the flux and torque by using a current control loop. This type of control presents several advantages such as: good torque response, accurate speed control, and achievement of full torque at zero speed. The Field Oriented Control schematic block diagram is presented in Figure 9.
MPPT CONTROLLER DESIGN
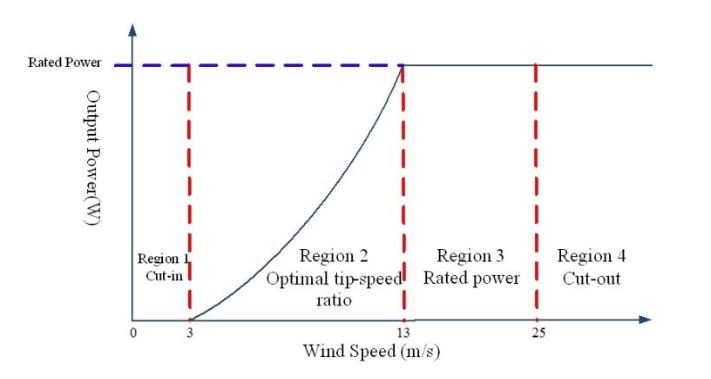
Figure 10. Four control regions in a wind turbine
As discussed in the previous paragraph, there are four different regions in a wind turbine, as shown in Figure 10. Region 1 is where the wind speed is below the cut-in speed, and pitch should keep in standby mode (90°). While the wind speed is large enough to drive the turbine but not enough to reach the rated speed, the pitch system will move to working mode for keeping 1° of pitch angle, and the turbine generator is controlled to capture the optimal power in Region 2. During Region 3, between the cut-out speed and the rated wind speed, the wind turbine reaches the maximum power capacity at rated power which is also the best region for power generation.
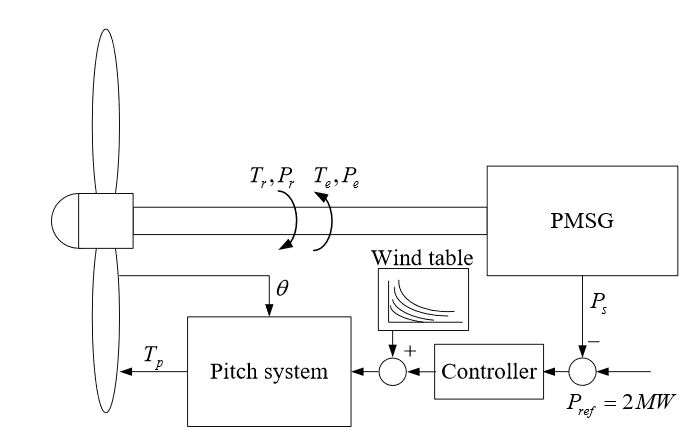
Figure 12. Control system configuration in Region 3
That means the synchronous generator cannot keep the rotor in rated rotating speed. In order to solve this problem, the pitch control strategy should be built to reduce the power coefficient so that the rotor can be maintained at the rated speed. In other words, the aerodynamic loading should be changed by rotating the blade pitch angle in Region 3. Meanwhile, this controller is used to implement constant generator rated power by using the pitch control algorithm. Figure 12 shows the control system configuration of maximum power tracking in Region 3.
SIMULATION RESULTS AND COMPARISON
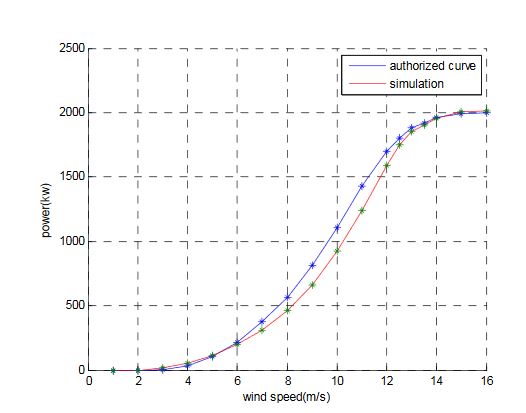
Figure 14. Power curve comparison of the practical wind turbine and the simulation
In Figure 14, the power curve of simulation is similar to the authorized curve. However, the power acquisition in middle wind speed level is below the authorized data. To explain this difference, the curve from simulation is still reasonable. Due to the wind power equation from Equation (1), wind power is proportional to the cubic of wind speed, which is also consistent with the curve in simulation (in 5 m/s and 10 m/s). Furthermore, the location of the anemometer has a strong influence on the result.
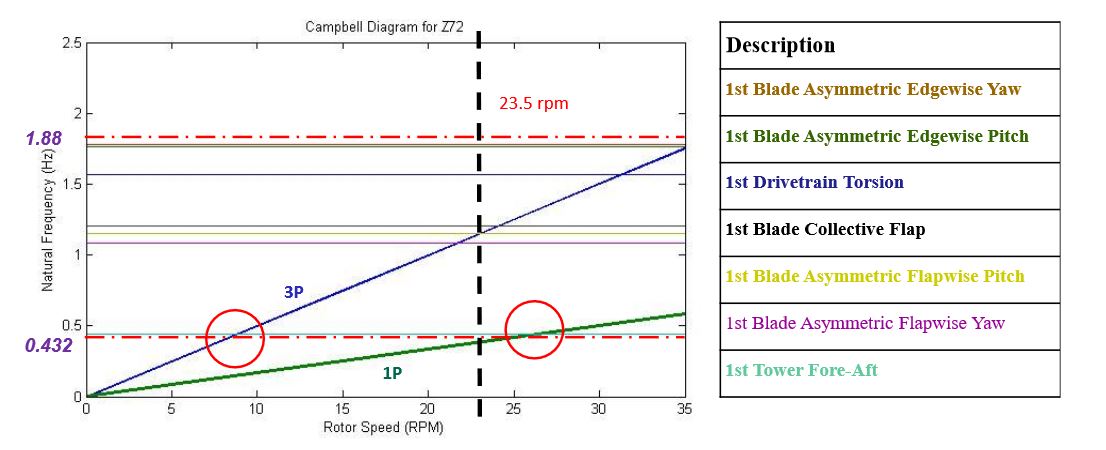
Figure 18. Campbell diagram of 2 MW wind turbine
With the help of this interface, a Campbell diagram can be developed in design and analysis, as shown in Figure 18. By sketching the curve of different mode frequencies versus rotating speed, the resonance point of frequency can be determined and forecasted beforehand , as the red circles shown in Figure 18. At approximately 26.5 rpm, blade 1P hit the first tower fore–aft frequency, which is also observed in the real time. Thus, we can create a rule-based control strategy depending on different model of wind turbine with the help if this Campbell diagram.
CONCLUSIONS
The paper not only proposed a novel co-simulation system of wind turbines combining three advanced softwares, but also built up a comprehensive data comparison with a real wind turbine. Each software played a different role in the simulation to achieve an overall system dynamic response. Meanwhile, in order to present the dynamic response of the wind turbine, three subsystems such as DC servo pitch driven motor, AC induction yaw driven motor, and one directly driven permanent magnetic synchronous generator were built up to drive the components simultaneously.
Besides, a system controller with control strategies was set up to achieve the optimal power tracking control with Kω2 law. The simulation results in different regions proved the system controller worked perfectly in a correct mode with a good response. Finally, the parameters of each subsystem were adjusted through SCADA comparison to ensure the reliability of this simulation.
Source: National Taiwan University
Authors: Ching-sung Wang | Mao-hsiung Chiang
>> 200+ Matlab Projects based on Control System for Engineering Students