ABSTRACT
Digital communications continues to be a relevant field of study as new technologies appear and old methodologies get revisited or renovated. The goal of this research is to look into the old digital communication scheme of Bell 202 used by APRS and improve software based demodulation performance. Improved performance is defined by being able to correctly decode more packets in an efficient, real time, manner. Most APRS demodulation is currently done using specialized hardware since that yields the best performance.
This research shows that through using Sivan Toledo’s javAX25 software package, new demodulation algorithms can be implemented that decode more Bell 202 encoded AX.25 packets than the existing software could. These improvements may help drive the adoption of software demodulation since it is a low cost alternative to specialized hardware.
APRS BACKGROUND AND DEFINITIONS
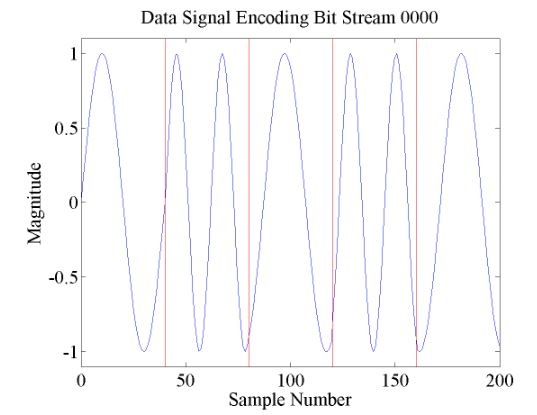
Figure 2.1. Example Bell 202 signal encoding the bit stream ’0000′
The convention in FSK is for the higher frequency to correspond to the mark and the lower one be the space. An example Bell 202 AFSK signal can be seen in Figure 2.1. In Figure 2.1 and others to follow, the horizontal axis is a relative sample number from the audio file. Since all audio was captured at 48000Hz and the Bell 202 signal is 1200 baud this works out to each baud being 40 samples.
APPROACHES TO ACCESSING THE APRS NETWORK
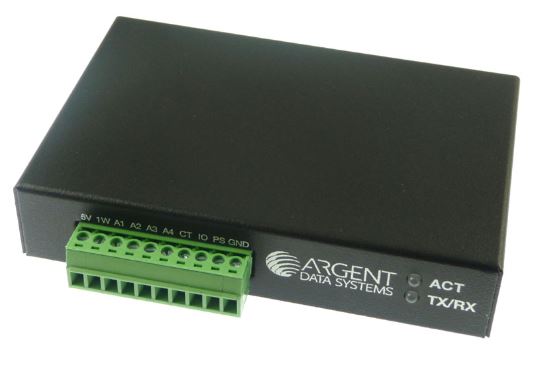
Figure 3.2. Image of Argent Data’s OpenTracker 3
Some examples of APRS exclusive devices are Argent Data’s OpenTrackers (Figure 3.2), Byonics TinyTrack, and Fox Delta’s Fox Track. These compact packages along with a radio and a GPS module perform APRS tasks at a satisfactory level for many users.

Figure 3.3. Image of the Yaesu FTM-350 Radio which has APRS integrated
Since they are all small embedded systems they cannot perform all of the features that APRS supports, one example is the messaging service. Since these devices do not have a display or a keypad, there is no way to input or display a message. Certain radio manufacturers have begun integrating the TNCs into the radios themselves to utilize the radio’s screen. The Kenwood TM-D700 series and Yaesu FTM-350 (Figure 3.3) are examples.
BELL 202 DEMODULATION TECHNIQUES
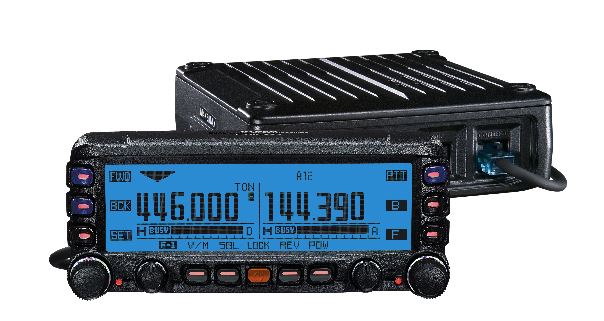
Figure 4.1. Example of a coherent FSK signal

Figure 4.2. Example of a non-coherent FSK signal
This means that there is a continuous signal at bit boundaries and there are no jumps as the signal changes from one frequency to another as seen in Figure 4.1 as opposed to non-coherent Figure 4.2 which does have these jumps. Another name sometime applied to this method of FSK, coherent FSK, is continuous-phase frequency shift keying or CPFSK.
DEMODULATION CHALLENGES
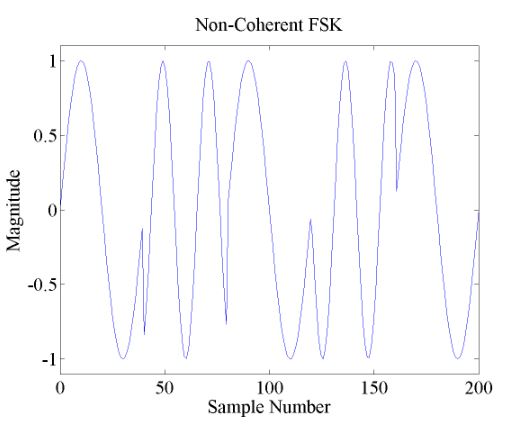
Figure 5.1. An example Bell 202 signal with DC offset problems
As the performance of zero crossing algorithms were investigated it was evident that this was a challenge. If one assumes that the signal is centered about zero, and it is not, the logical decisions made with this incorrect assumption will hence not hold true. Figure 5.1 shows that the signal is not centered around zero. This lack of the signal being centered around 0 (or ground) is why it is said to have a DC offset.
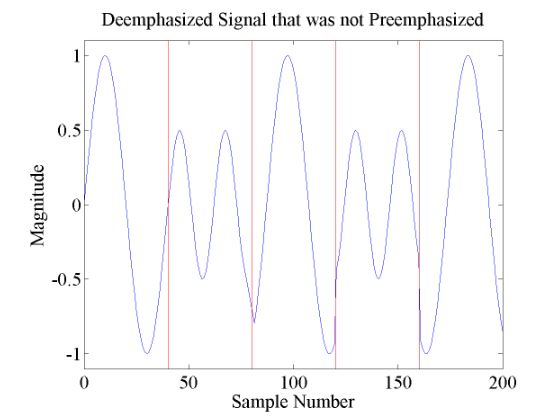
Figure 5.3. An example signal that was not preemphasized, but was deemphasized
This would mean that a signal transmitted out of a radio with a data port may not be emphasized, but then when received through the speaker out of another radio would be deemphasized. The effects of a non-emphasized signal being deemphasized can be seen in Figure 5.3. This causes problems with the demodulation because it can not be assumed that the relative powers of each frequency will be equal since they will have different magnitudes in this case.
DEMODULATOR BENCHMARKING
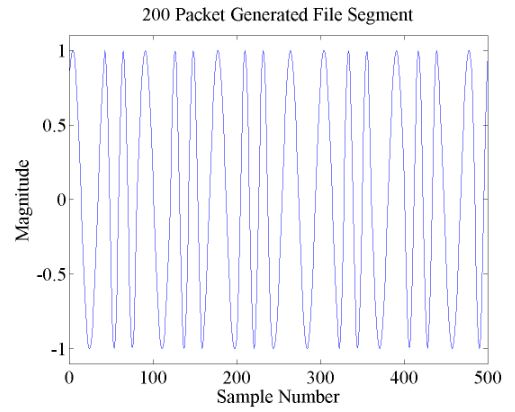
Figure 6.1. Example of the AFSK signal present in the 200 packet generated file
The second file was generated in software using Toledo’s javAX25 package. All that is relevant at this point is that it has perfect levels (1200Hz and 2200Hz tones are at the exact same level) and contains 200 packets each separated by 300ms (this was chosen so that the space between packets was sufficient to be heard) making the file quite a bit longer. A sample from the 200 packet audio file can be seen in Figure 6.1.
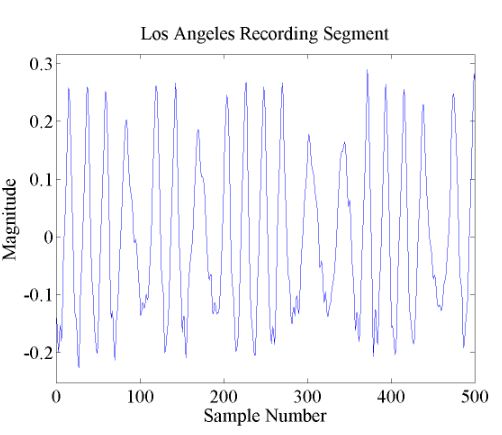
Figure 6.3. Example of the AFSK signal in Track 1 of the Los Angeles Recording Test File
This is considered the file use for bench marking in the community and when people discuss the performance of their demodulator, they quote it in how many packets they were able to successfully decode out of this file. An example segment from this off air recording of APRS traffic can be seen in Figure 6.3.
TESTING
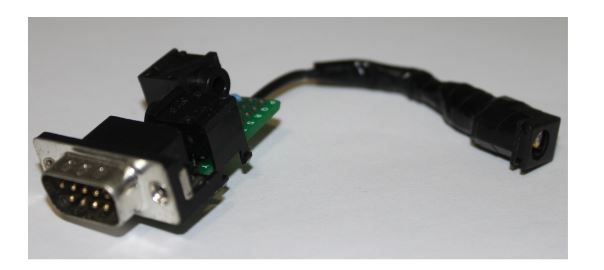
Figure 7.2. Break-out board fabricated for hardware testing
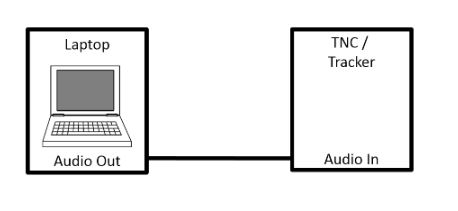
Figure 7.3. Block diagram of the test setup used for testing APRS hardware
Since this was common between multiple pieces of hardware, a simple break-out board was created that allowed for a more universal audio transport mechanism of 2 3.5mm tip-ring-sleeve connectors (one audio in and one out), and also a 2.5mm barrel jack for power (Figure 7.2). This was much simpler than actually interfacing with a radio since the audio could just be played from a laptop into the device using a standard 3.5mm tip-ring-sleeve cable (Figure 7.3).
IMPLEMENTATION
This chapter will go through all of the implementation details of each demodulator implemented. They will be presented in order of complexity, with the more intricate ones presented last. This also will introduce them mostly chronologically since naive approaches allowed for more insight to be gained into the javAX25 software package, as well as APRS packet demodulation, before implementing more complicated algorithms.
RESULTS
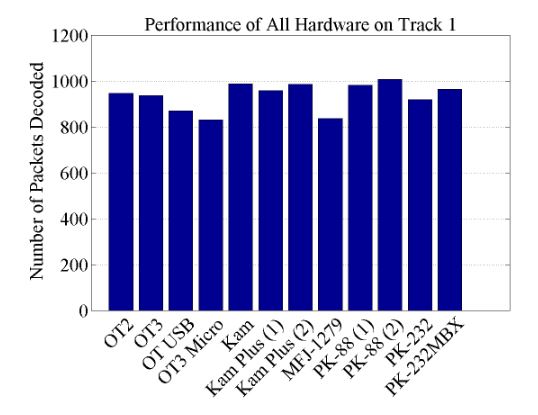
Figure 9.2. Number of packets successfully decoded for all tested hardware on the Track 1 test file
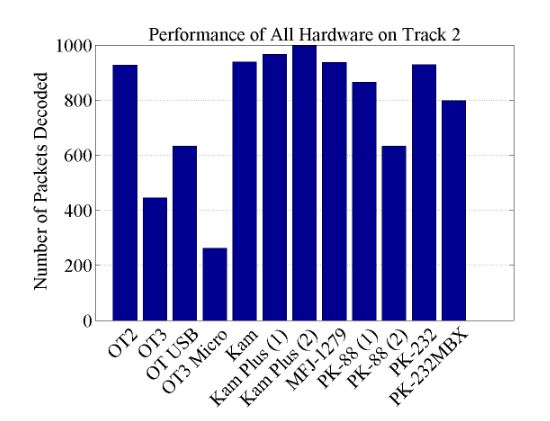
Figure 9.3. Number of packets successfully decoded for all tested hardware on the Track 2 test file
The next two files are the ones that were used most extensively in the testing for comparison and tuning. Primarily the first, which is just a recording of traffic off the air. They are Track 1 and 2 from the APRS CD mentioned in the Demodulator Benchmarking Chapter. The results from Track 1 are in Figure 9.2 and Track 2 in Figure 9.3.
FUTURE WORK
The sections in this chapter will explain some aspects that this project uncovered that have the potential for future research. There are three main items that the author thinks should be explored in more depth as future work in this area of AX.25 software based demodulation, including the Discrete Short-Time Fourier Transform, the use of the checksum for forward error correction, and to actually integrate these demodulators with live traffic from a radio.
CONCLUSION
This research set out to try and prove that software could do APRS demodulation better than the hardware. Depending on perspective, it may have done so. However, at the very least the research shows that there are many ways to approach the challenge of demodulating these packets and presents the relative performance of over 10 software based approaches and 12 dedicated hardware approaches, whether that hardware is an OpenTracker or TNC.
In the end, the software did do better than the average result using hardware, but in the primary benchmarking file, software was only able to decode 975 packets as opposed to the 1007 that the best piece of hardware detected. The software’s improved performance coupled with its low cost, continues to make it an attractive approach over dedicated hardware.
Source: California Polytechnic State University
Author: Robert F. Campbell