ABSTRACT
Vehicular adhoc Networks (VANETs) enable vehicles to communicate with each other as well as with roadside units (RSUs). Although there is a significant research effort in radio channel modeling focused on vehicle-to-vehicle (V2V), not much work has been done for vehicle-to-infrastructure (V2I) using 3D ray-tracing tools.
This work evaluates some important parameters of a V2I wireless channel link such as large-scale path loss and multipath metrics in a typical urban scenario using a deterministic simulation model based on an in-house 3D Ray-Launching (3D-RL) algorithm at 5.9 GHz. Results show the high impact that the spatial distance; link frequency; placement of RSUs; and factors such as roundabout, geometry and relative position of the obstacles have in V2I propagation channel. A detailed spatial path loss characterization of the V2I channel along the streets and avenues is presented.
The 3D-RL results show high accuracy when compared with measurements, and represent more reliably the propagation phenomena when compared with analytical path loss models. Performance metrics for a real test scenario implemented with a VANET wireless sensor network implemented ad-hoc are also described. These results constitute a starting point in the design phase of Wireless Sensor Networks (WSNs) radio-planning in the urban V2I deployment in terms of coverage.
BACKGROUND
An in-house developed 3D-RL code has been used to analyze the electromagnetic propagation behavior of the considered scenario. The algorithm is based on GO and GTD, with its uniform extension, the Uniform GTD (UTD). The main principle of the RL techniques is that the wave front of the radiated wave is identified with a number of rays that propagate in the space according to optic and electromagnetic theories. Each ray propagates in space as a single optic ray.
SIMULATED URBAN SCENARIO
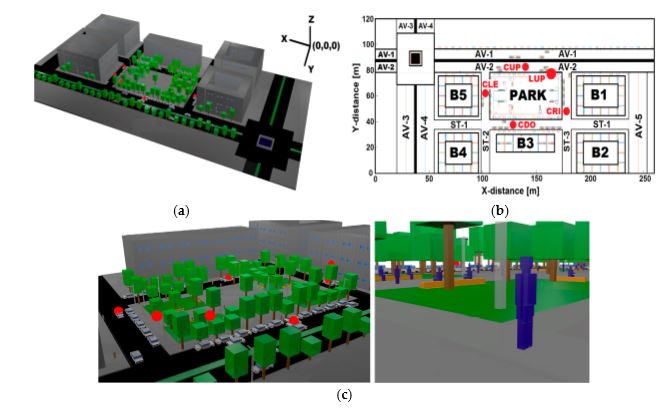
Figure 1. Scenario: (a) 3D frontal-view; (b) 2D back-view; and (c) close-up view
Figure 1a depicts a 3D aerial-view of the modeled scenario where buildings, streets and trees are shown. Figure 1b displays a 2D aerial-view which identifies the main points and areas of interest and its relative position (x, y), according to Table 1. Figure 1c shows a close-up view of some scenario elements used in the 3D-RL simulation.

Table 2. Simulation parameters
RESULTS
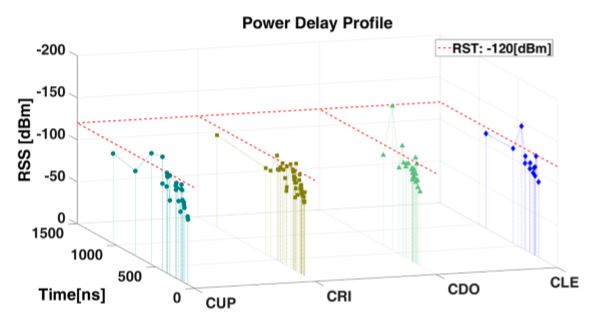
Figure 4. Power Delay Profile
Figure 4 shows a large number of power rays (echoes) in a time span of 100 to 1500 ns, which are the result of the multipath channel defined by the geometrical position between the transmitter and receiver, and the surrounding physical environments. The first ray arrives at 100 ns to CUP (located at 24.104 m from Tx) and at 200 ns to CLE (located at 52.386 m from Tx) which show the influence of the Tx-Rx distance in the arrival time of the first ray to the Rx.
The time span evidence the ocurrence and duration of reflected, refracted, and difracted rays that arrive to the specific point. The density of rays is related to the Tx-Rx vicinity and the LoS conditions: higher density of rays with RSS above-120 dBm are present in CUP and CRI compared to CDO and CLE.
In previous work, it was shown that higher frequencies (5.9 GHz vs. 868 MHz) imply higher time dispersive effects. 4.3.2. Mean Excess Delay, Root Mean Square Delay Spread and Coherence Bandwidth−120 dBm are present in CUP and CRI compared to CDO and CLE. In previous work, it was shown that higher frequencies (5.9 GHz vs. 868 MHz) imply higher time dispersive effects.
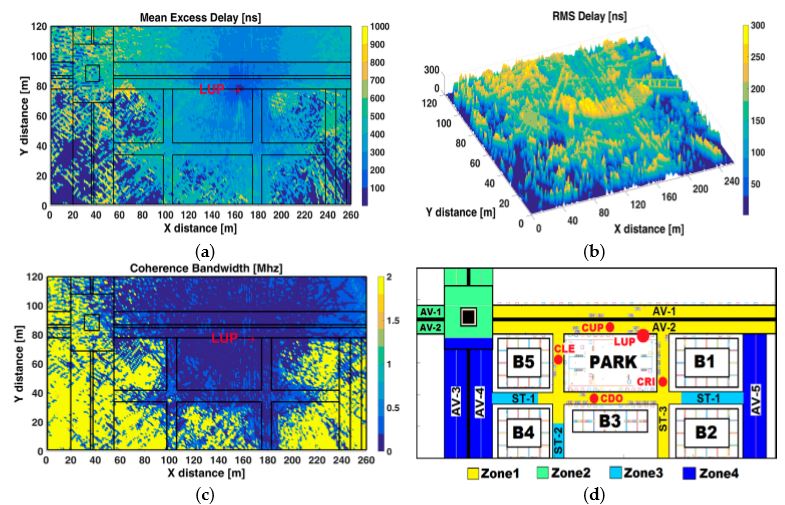
Figure5. (a) Mean Excess Delay; (b) RMS delay spread; (c) Coherence Bandwith; and (d) RSS zone map
According to Figure 5a, the mean excess delay is highest at zone 4 (NLoS) due to the distance and the obstruction caused by buildings, followed by zone 2 (LoS) where the roundabout causes great fluctuations in the received signal, then zone 3 under NLoS condition where the corridor-configuration causes reflections of the power signal, and finally the lowest mean excess delay is at zone 1 (LoS).
It is important to note that lower values of mean excess delay into and behind buildings (B1, B2, B3, B4, and B5) denote the absence of signal due to the phenomena of absorption and reflection of propagated signals by the concrete walls and glass windows. This finding is in agreement with that reported in, where it is stated that the NLoS scenarios have much higher mean excess delay than LoS scenarios as the strong LoS components tend to dominate the PDP, and the transmitted signals in NLoS environments will encounter many reflections along their path to the receiver.
MEASUREMENT VALIDATION
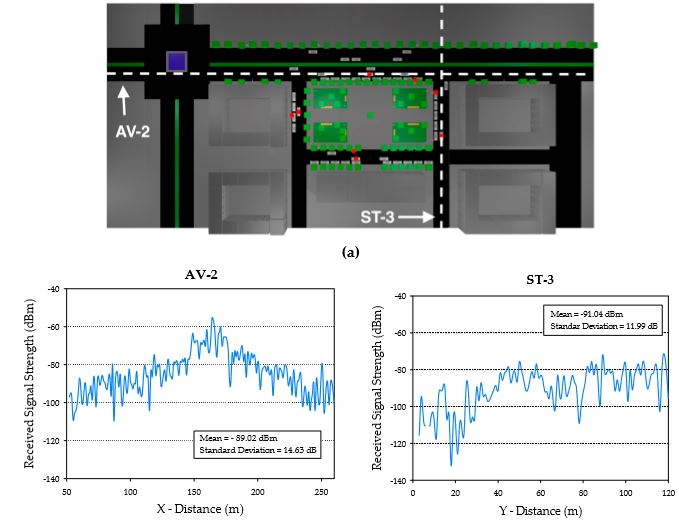
Figure 6. (a) Location of AV-2 and ST-3; (b) estimation of movement related standard deviation loss component for both locations
Figure 7a shows the nine points used as reference for the measurements campaign at zone 1: points 1 and 2 are along ST-3, points 3–5 are along ST-1, points 6 and 7 are along ST-2 and points 8 and 9 are along AV-2. Figure 7b depicts a comparison between measurements versus the 3D-RL technique and versus PLMs defined in Section 4.2.
RSS values estimated by 3D-RL were obtained taking as reference the same spatial coordinates of the points (real measurements) and evaluating the resulting distance in a first order polynomial that represent a LS fitting of a 10 m street or avenue segment that include the same coordinates in the three-dimensional mesh of cuboids in which the scenario was divided. PLM1was evaluated according Equations (1) and (2), and PLM2 was evaluated according Equation (3).
APPLICATION
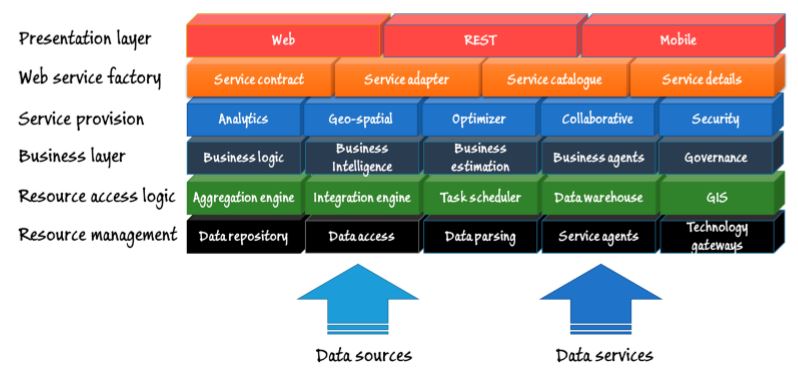
Figure 8. Architecture of the system
Figure 8 depicts the architecture of the system, which is structured in six layers. Lower layers are related to data acquisition. Data sources and data services (data collected by the WSN, data obtained from the monitoring service and data collected from the collaborative APP) provide the resources needed to provide services at the higher layer. Resource management includes a MySQL database as data repository.
Data are gathered through the data access service; a web service that collects data provided by the WSN, the APP and the monitoring service. Since data come from different sources, and it arrives in heterogeneous formats, there is a conversion module in charge of dataparsing before its storage into the repository.
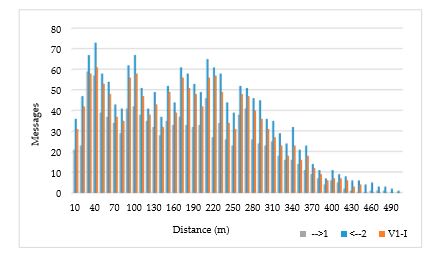
Figure 10. Messages transmitted by vehicle v1 and received by v2 and by the infrastructure
Figure 10 illustrates the communication flow between the pair of vehicles and the infrastructure. The total amount of messages transmitted by the vehiclev1 (→1) is1681, while 1163 of those messages have been received by vehicle v2 (←2), the 69.19% of the messages transmitted.
If we consider the infrastructure, the node placed at the semaphore has received (V1-I) 1532 messages of the transmitted by v1, the 91.14% of the transmitted. We appreciate a low packet error rate. This is mainly because the band of 5 GHz is not occupied, in accordance with previous interference measurement and analysis and its impact in overall system performance.
CONCLUSIONS AND FUTURE WORK
An in-house determinstic 3D-RL tool was used to obtain an accurate estimation of V2I radio propagation parameters such as RSS, large-scale path loss and multipath metrics in an urban scenario at frequency of 5.9 GHz, with the aim to bring insight about some radio propagation parameters essential in the design phase of WSNs deployment. The typical urban scenario was characterized in 3D high level of detail, which for the author’s knowledge, it has not been presented in previous works.
It permits accurate results of radio propagation parameters that could be replicated in similar environments. Two analytical PLMs were used to establish comparison with the 3D-RL simulation, and the analysis of goodness-of-fit (R2) for one of them shows good agreement under LoS and certain NLoS conditions (street corridor-configuration), however they are unable to represent the NLoS propagation behind the buildings.
Wireless channel estimation as well as interference analysis provide network node density, in the range of 1/node/104 m2 and 1/node/103 m2, as a function of coverage/capacity restrictions given by LOS/NLOS conditions within the urban vehicular scenario.
Source: University of Navarre
Authors: Fausto Granda | Leyre Azpilicueta | Cesar Vargas-rosales | Peio Lopez-iturri | Erik Aguirre | Jose Javier Astrain | Jesus Villandangos | Francisco Falcone