ABSTRACT
Improving farm productivity is essential for increasing farm profitability and meeting the rapidly growing demand for food that is fuelled by rapid population growth across the world. Farm productivity can be increased by understanding and forecasting crop performance in a variety of environmental conditions. Crop recommendation is currently based on data collected in field-based agricultural studies that capture crop performance under a variety of conditions (e.g., soil quality and environmental conditions). However, crop performance data collection is currently slow, as such crop studies are often undertaken in remote and distributed locations, and such data are typically collected manually.
Furthermore, the quality of manually collected crop performance data is very low, because it does not take into account earlier conditions that have not been observed by the human operators but is essential to filter out collected data that will lead to invalid conclusions (e.g., solar radiation readings in the afternoon after even a short rain or overcast in the morning are invalid, and should not be used in assessing crop performance). Emerging Internet of Things (IoT) technologies, such as IoT devices (e.g., wireless sensor networks, network-connected weather stations, cameras, and smart phones) can be used to collate vast amount of environmental and crop performance data, ranging from time series data from sensors, to spatial data from cameras, to human observations collected and recorded via mobile smart phone applications. Such data can then be analysed to filter out invalid data and compute personalised crop recommendations for any specific farm.
In this paper, we present the design of SmartFarmNet, an IoT-based platform that can automate the collection of environmental, soil, fertilisation, and irrigation data; automatically correlate such data and filter-out invalid data from the perspective of assessing crop performance; and compute crop forecasts and personalised crop recommendations for any particular farm. SmartFarmNet can integrate virtually any IoT device, including commercially available sensors, cameras, weather stations, etc., and store their data in the cloud for performance analysis and recommendations. An evaluation of the SmartFarmNet platform and our experiences and lessons learnt in developing this system concludes the paper. SmartFarmNet is the first and currently largest system in the world (in terms of the number of sensors attached, crops assessed, and users it supports) that provides crop performance analysis and recommendations.
A USE CASE AND RELATED CHALLENGES FOR SMART FARMING
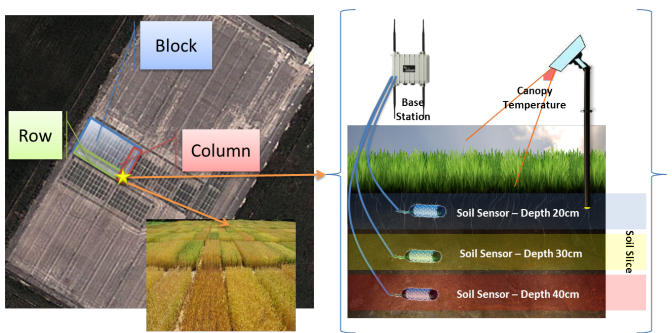
Figure 1. Overview of Phenonet
Figure 1 presents an overview of this Phenonet study that is conducted on a block of land that is divided into hundreds of plot. A plot is an intersection of a row and a column in a block of land and hosts a specific treatment to the crop being studied. For example, each plot may host a different application of fertilizers or host the application of the same fertilizer at different times. This Phenonet study requires support for real-time collection and delivery of data to biologists, who then share their insights with growers and farmers, as well as related scientific organisations.
RELATED WORK AND CHALLENGES IS BUILDING IOT-BASED PLATFORMS FOR SMART FARMING
Relational database systems (e.g., mysql) have been the historic choice for storing data from the sensors for later retrieval, analysis, and visualisation. However, the performance of these systems can be compromised by large streams of time-series data, and they do not address most of the challenges outlined in the Section. To meet such challenges vendors such as John Deere, IBM, and SensorCloud currently explore or provide proprietary solutions that support specific sensors. However, vendor-specific solutions provide limited or no interoperability with other devices in the IoT ecosystem. Vendor lock-in is also a serious issue.
THE SMARTFARMNET IOT PLATFORM FOR SMART FARMING
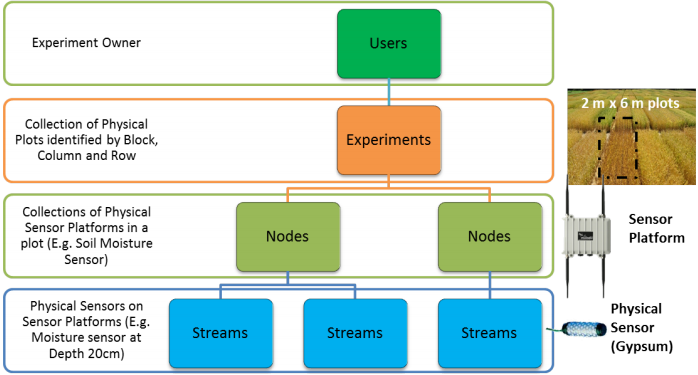
Figure 2. SmartFarmNet’s data model
The layout of a typical crop study (referred to as “experiment” in the data model) is illustrated in Figure 2. Such studies involve a particular area (one or more plots) in a field. Any farm can be divided into plots, and the granularity of the analysis supported by SmartFarmNet is currently 9–10 square meters. The plots are mapped to the node level that represents the sensor network platform (hosting all related communication and processing capabilities). Physical sensors observing a physical phenomenon (e.g., gypsum block sensors measuring soil moisture at multiple depths) are connected to corresponding streams.
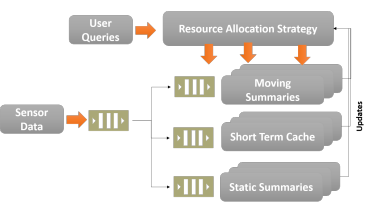
Figure 4. SmartFarmNet—scalable data analysis of sensor data
The data stream processing model of SmartFarmNet is presented in Figure 4. The platform provides three levels of data storage: (1) Short Term Cache; (2) Moving Summaries; and (3) Static Summaries. The summaries computed over the moving aggregate window are termed “moving summaries”, and are updated with new incoming data streams. The static summaries are provided for data streams whose data does not change rapidly over time, hence not requiring frequent re-computation of summaries. Finally, the short-term cache is used to store raw data in order to improve the response time of raw data requests.
The resource allocation strategy uses the combination of the query and the performance of each storage to determine where to store incoming data streams. The unique feature of the platform is its elasticity. A stateless process thread works on the queue (at the left of Figure 4) to process each individual sensor data stream. Therefore, we can achieve a high degree of distributed and parallel processing that can utilise available computing resources very efficiently.

Figure 5. SmartFarmNet architecture
DIY: do-it-yourself; RDF: resource description framework; API: Application programming interface.
Figure 5 depicts the architecture of the SmartFarmNet platform. SmartFarmNet provides support for bring-your-own sensor, i.e., the ability to integrate and describe virtually any IoT device, including sensors, mobile smart phones, cameras, farming equipment, etc. The data generated from such IoT devices are initially processed on local SmartFarmNet gateways. The SmartFarmNet gateways communicate with both the sensors and the SmartFarmNet Platform running in the cloud.
SMARTFARMNET PLATFORM IMPLEMENTATION
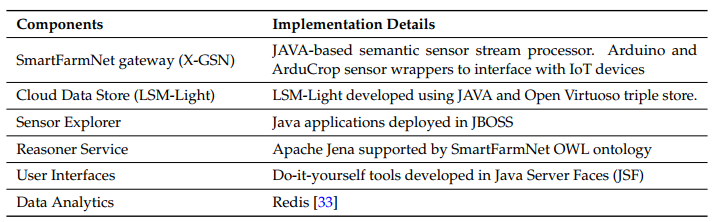
Table 2. SmartFarmNet platform—implementation details. LSM-Light: linked sensor middleware-light
As mentioned before, the SmartFarmNet platform is built on the widely used open source platform for Internet of Things, namely OpenIoT, available for free download. Table 2 presents the implementation details of the platform. The entire platform is deployed in a JBOS application container, while the support for real-time scalable data analytics is built independently using Redis, an in-memory data store.
SMART FARMNET EVALUATION
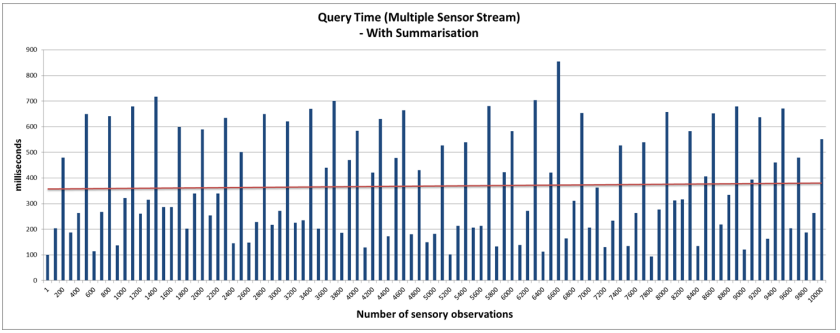
Figure 10. Query access latency with real-time statistical analysis—multiple sensor stream
Figure 10 presents the query response time to retrieve the sensor data with the real-time statistical analysis feature. As can be noticed, the performance of SmartFarmNet with the real-time analysis is two-fold better than without real-time analytics. By taking advantage of the pre-compute stream summaries that are updated when a new data point arrives or when the time window changes, SmartFarmNet is capable of providing near real-time query response. For complex queries (such as data from multiple days), different micro summaries, such as hourly, daily, weekly, and monthly are used for quick computation.
LESSONS LEARNT
Support for virtually any IoT device:
The key challenge that we faced in developing the SmartFarmNet platform was managing the plethora of Internet of Things devices, ranging from wireless sensor networks to mobile smart phones to cameras, etc. Our solution was to focus on developing common interfaces (API) and consistent representation of sensors and their data using semantic web technologies and thus moving away from the traditional packaged hardware/software solutions.
CONCLUSIONS
In this paper, we presented SmartFarmNet, a pioneering effort in building a scalable sensor data acquisition, analysis, and visualisation platform for smart farming applications, based on the Internet of Things. We presented the architectural design of the platform that aims to support virtually any IoT devices, allow rapid ingestion and visualisation of IoT data using zero-programming effort (do-it-yourself principles), and provide a virtual laboratory environment for visualisation and sharing of study data. The proposed SmartFarmNet uses a unique and novel real-time statistical analysis approach that enables near real-time responses to user queries (validating the platform’s ability to scale in order to handle high-velocity data streams). Through evaluation using actual farming data, we validated the elasticity and scalability of the platform.
Source: Swinburne University of Technology
Authors: Prem Prakash Jayaraman | Ali Yavari | Dimitrios Georgakopoulos | Ahsan Morshed | Arkady Zaslavsky
>> IoT based Real-Time Projects for B.E/B.Tech Students
>> 200+ IoT Led Projects for Engineering Students
>> IoT Software Projects for Students