ABSTRACT
Product service system (PSS) design has drawn much attention in the last decade and is expected to be affected by the fast-growing application of Internet of Things (IoT) technologies. This study proposes a six-step design method by extending visual mapping design methods for the PSSs that plan to apply IoT technologies. A new concept of “pseudo actors” that highlights the role of the objects incorporating IoT technology is introduced in plotting actors and system maps and a useful table is recommended to help evaluate alternatives of IoT technology application.
An example of a battery swapping system for electric scooters is illustrated for application potential. Actors and system maps with “pseudo actors” are presented and analyzed, while IoT technologies are applied in batteries, charging stations, cell phones, and scooters. Designers could use the proposed method to select appropriate application of IoT technologies with higher customer value in a product service system design.
VISUAL MAPPING METHODS FOR A PSS DESIGN AND IDEAS FOR PROPOSING A NEW METHOD
Visual mapping design methods have been used in the conceptual design phase to comprehensively identify pertinent stakeholders, their relationships with each other, and their roles in the service system. This type of method enables designers to identify how value is generated in the whole network through service provision. It can also reveal opportunities to include other actors and stakeholders who are not yet considered in the current system, as well as how relationships among actors can be established. As various IoT technologies are to be included in service systems, the extension of the mapping methods can be made to identify and highlight the roles and the effects of applying them.
A Visual Mapping Method: Actors and System Maps
Visual mapping methods are widely used at the start of a service system development that enables a design team to identify pertinent stakeholders and their relationships. The major advantage of those methods is to identify and visually present the stakeholders, including customers, who are involved with the effective delivery of the product or service to the customers.
Reasons and Ideas for Proposing a New Method
As mentioned earlier, IoT technologies like identification and tracking technologies, wired and wireless sensors and actuator networks, enhanced communication protocols, and distributed intelligence for smart objects have been applied in service systems. With IoT technologies, an object may become “smart and connected” and have the ability to memorize, communicate, and deliver services, thereby possibly supporting or even replacing conventional human actors.
A METHOD PROPOSED TO EVALUATE SYSTEM IMPROVEMENT WITH IOT TECHNOLOGY APPLICATION
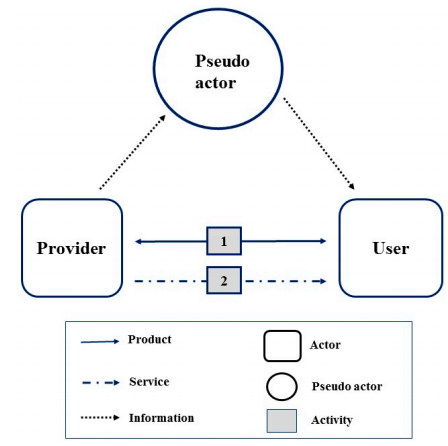
Figure 1. An illustration of adding one pseudo actor to an actors and system map
Figure 1 illustrates a simple example where two rectangles represent conventional actors: the right one is customers, the left one denotes service providers, and the circle denotes a pseudo actor. Because of a pseudo actor joining in, the flows between the two conventional actors increase. For example, a car (pseudo actor) in a car rental service is equipped with some IoT technologies so that additional information could be delivered to customers directly from the “smart” car. By drawing a map, designers can visualize and analyze if the service level is improved by pseudo actors joining in. One can imagine that with these pseudo actors joining in the PSS the interaction (flows of products, services, and information) among actors changed and the potential service improvement is identified much more easily.
A CASE OF DEVELOPING BATTERY SWAPPING SERVICES FOR ELECTRIC SCOOTERS IN TAIWAN
As an illustrative example of the proposed method, a PSS for the battery swapping service for electric scooters is selected. This section briefly presents some background on promoting electric scooters with battery swapping services in Taiwan. The first reason for promoting battery swapping services is that charging the battery of an electric scooter is still time-consuming; even in a fast charging mode it may still take more than half an hour, so battery swapping services provide a convenient choice. Secondly, battery swapping services encourage users to simply buy services instead of buying batteries, thereby reducing resource use and encouraging sustainability.
In this context, the Taiwan government decided to subsidize battery swapping service systems for electric motorcycles and bikes in 2012 (EPA, Taiwan). The original master plan presented by the local government includes: (1) encouraging start-up companies to build service systems including swapping stations, standardized batteries, and service infrastructure; and (2) persuading major motorcycle manufacturers to adopt standardized batteries so that motorcycles from different brand names could use the same swapping service. In the original business model, a user purchased a motorcycle and a battery and then paid for each swapping service.
AN ILLUSTRATIVE EXAMPLE OF BATTERY SWAPPING SERVICE IMPROVEMENT USING THE PROPOSED METHOD
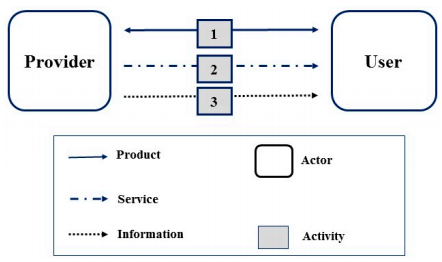
Figure 2. An actor and system map for conventional service without IoT technology
Unmet needs or dissatisfaction of customers are identified, assuming that the battery swapping service is conducted in a conventional way where a user takes the battery to a service provider to get a charged one when the battery power is exhausted. This is similar to the situation users faced in Taiwan before 2015. The user simply has to trust the service provider to provide a fully charged battery. Figure 2 shows a simple “actors and system map” describing the service operation without using IoT technology.
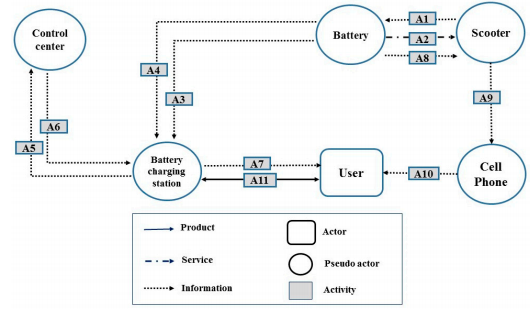
Figure 3. Actors and system map for the first alternative combination of IoT technology application
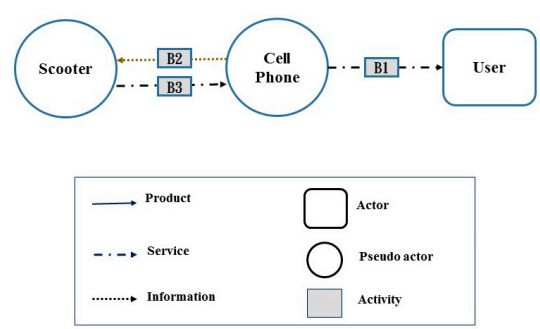
Figure 4. Actors and system map for the second alternative combination of IoT technology application
Figures 3 and 4 show the “actors and system maps” for two illustrative alternatives for two unmet needs, in which arrows represent the flows between actors and pseudo actors, rectangles denote conventional actors, and circles denote pseudo actors.
CONCLUSIONS
This study proposes a practical design method that extends visual mapping methods by introducing “pseudo actors” to help design PSSs that plan to incorporate IoT technologies. The reasons for introducing pseudo actors and how to identify them are presented. Because of the differences between pseudo actors and conventional actors, there are advantages to differentiating pseudo actors from conventional actors in plotting actors and system maps. Designers can visualize and analyze the potential effect of applying IoT technologies with the maps including the nodes of pseudo actors and conventional actors and the flows of information, services, and products among them.
By plotting the pseudo actors, the role and interaction with other actors of the objects applying IoT technologies are distinguished from those of conventional actors. This method also recommends a useful table to quantitatively evaluate alternatives of IoT technology application based on users’ weightings of their unmet needs. The idea of bridging the customer value and technology alternatives for evaluation is inspired by the QFD method. To make the method more practical, a six-step procedure is proposed that covers three stages of creating customers’ value including identifying unmet needs, finding technological solutions, and selecting alternatives that generate greater value.
The six steps include (1) identify unmet needs or dissatisfactions and provide weighting factors; (2) identify objects (candidate pseudo actors) that adopt IoT technologies; (3) identify feasible alternative combinations of IoT technologies for solving each unmet need. Pseudo actors are identified and included in plotting actors and system maps herein to facilitate feasibility check; (4) use a recommended table to summarize alternative combinations of IoT technologies for each unmet need; (5) quantitatively evaluate the contribution of each alternative to each unmet need by plotting extended actors and system maps; and (6) calculate total weighted scores so that the relative value created by the alternatives can be presented to designers for decision-making.
Source: National Cheng Kung University
Authors: Li-Hsing Shih | Yen-Ting Lee | Fenghueih Huarng