ABSTRACT:
Computer network these days tend to grow over size increasing vulnerable points of network. To assess the stability and security of computer network, one might not understand those minute points of susceptibility with high volumes of generated reports.
With complex networks in place and increase in population of mobile network nodes, the report might likely turn into pages of data than information as the issues cannot be addressed at a single go.
Every organization performs security analysis for safe guarding their networks but there is gap in the process which is being followed. Organizations perform Vulnerability assessments (VA scans) on their complex networks. The output of VA scans will be a report on individual hosts and its vulnerabilities.
Though the report makes some sense but with respect to the aspect security we cannot prioritize the host based on the vulnerabilities because we are not sure from where the attack happens.
So this gap is filled with attack graphs where the output of the VA will be processed to attack graph generation tools which generates attack graphs. It provides us the bird view over the entire network.
Yet, there comes another problem as the VA report being processed in attack graph tools without any evaluation which leads to generate graph out of raw report. Evaluation of the VA report has to be performed for providing precise and potential data to be processed into the attack graph tools for accurate results.
A visual approach, precisely speaking a graphical model of depicting the devices and the data flow can really surge the speed of zeroing in to weak nodes of the chain. The Attack graph model collects data based on vulnerability reports and will mine the data for key nodes and routes to project an overview of networks liability.
This can be restricted and configured to network pools that are identified important at a later stage after assessment. The proposed approach will target those vulnerabilities which can be exploited remotely with risk factor “Critical” & “High” with CVSS base Score between “10.0-7.0”.
These critical vulnerability selection rules will be applied in vulnerability scanners and the report exported will only be with the selected data based on critical severity parameters. The same will be processed into the attack graph tool.
This approach not only reduces the complexity to most extent but also provides genuine information related to gaps where an attacker can sneak into the network.
LITERATURE REVIEW
Example Case Study of STUXNET Multistage Attacks:
Have chosen this case study to explain the exploitation of vulnerabilities which are spread across the network by a worm named “STUXNET” (an internet worm). Stuxnet designed by U.S and Israel in 2012 to attack Busher nuclear power plant in Iran (Mueller & Yadegari 2012).
Stuxnet,as saidit’s an internet worm which is coded to infect windows computers. USB sticks are it prime source of spreading into computers and later into its networks which are not generally connected to networks. Once it gets into the network, it has got its own techniques of propagation from machine to machine and gain privilege after its successful infection.
Computer Networks –Complexity and Security:
Let’s begin with computer networks, it is defined as connection between two computing devices to share their resources leading to work collectively and work in an organized way. As it’s a known fact that computer networks are combination of both hardware and software.
Networking is not always easy as it looks. It gets complicated with the time. Current day computer networks are generally considered to be complex structures. Let’s frame few things imagining what it takes for the kind of a structure that lets any computing device at any part of the world to communicate using a text, video, and image or any audio files.
Network Attacks and Security Practice:
It is very difficult in securing and managing large enterprise networks. These networks are always prone to physical, social engineering, application or network attacks where users will get driven to their reveal sensitive data unknowingly. In case of any successful attack the attacker achieves privileged level access (root/administrator) over the computer networks (Hunt & Zeadally 2012).
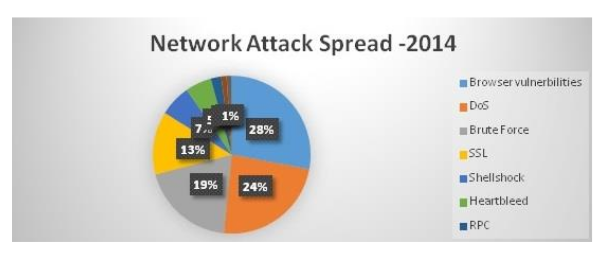
Network Attack Spread in 2014 (Green 2015).
Proposed Tools for Vulnerability Scanning:
This section deals with the industry renowned tools which are used to perform the vulnerability assessments. The current Information technology industry does have handful of vulnerability scanners both open source and commercial. NeXpose and Nessus are the prominent ones among the commercial editions in the industry and Open vulnerability assessment system (OpenV AS) is the advanced among the open source editions (Swiler & Phillips2006). In spite of using these advanced scanners the vulnerabilities identified are limited to a host.
INTRODUCTION OF ATTACK GRAPHS
Along with, hosts on the network and vulnerabilities are also increasing proportionately; it is evident to automate the process of evaluating vulnerabilities which are prone to attacks.
While evaluating the security of computer networks we even need to consider the isolated vulnerabilities which are identified. (Franqueira 2009) When it comes to large scale networks it contains numerous platforms and multiple software packages employed with several modes of connectivity.
What are Attack Graphs?
An attack graph is considered to be a directed graph with given sets of Attack paths , Conditions (Pre & Post), Attacker states. Theoretically, these graphs represent collection of instances proving how an attacker can break into the target system (Sheyner, OM 2004).
According to Reginald Sawilla and Xinming Ouattack graphs are mathematical abstraction of the details of possible attacks against any computer network. Basicallyattack graphs are segregated into two categories one being state enumeration graph and other is logical attack graph.
Factors That Influence the Creation of Attack Graphs:
- Non-monotonic or monotonic
- Multiple paths or single path
- Forward and backward chaining
- Deterministic and Probabilistic models
- Graph Visualizations
- Input file Formats
- Graph or logic based
What are the uses of attack graphs?
Attack graphs can prove to be very handy in the area of network security which comprises intrusion detection systems, improve defense mechanisms and for forensics analysis.
ATTACK GRAPH TOOLS
This section briefly presents working and features of the attack graph tools. Following are the attack graph generation tools.
MulVAL:
A logic-based tool used to generate attack graphs. MulVAL stands for Multi stage Multi host Vulnerability Analysis and it’s an open source. Xinming Ou is the author of the tool. Basically the generated attack graph has attack-step nodes, nodes of three types represented in oval (attack state), diamond (privilege nodes) and rectangular (configuration nodes) shapes (Ou, Govindavajhala & Appel 2005).
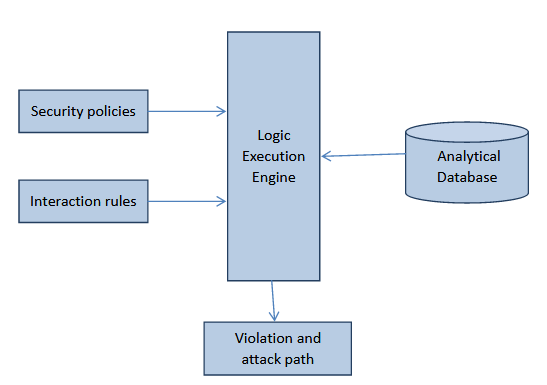
MulVAL Architecture.
EXPERIMENTAL SCENARIO ON GENERATION OF ATTACK GRAPH
In order to produce a quality solution with respect to the agenda a test was performed to evaluate the attack graphs in identifying realistic attacks on the organization’s IT networks with better visualizations. We are choosing one among the above listed tools and using them over our virtual created target networks. Later by, providing the brief information about the target networks along with its configurations and associated vulnerabilities.
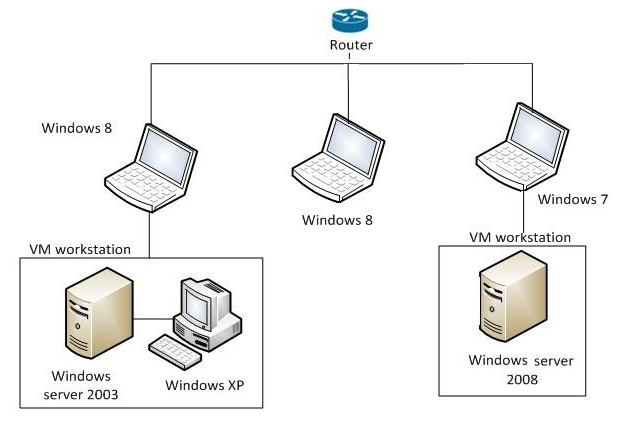
Experimental Network Topology.
RESULT ANALYSIS
The result for the generated attack graph was presented. Evaluation of the predictions of MulVAL will signify the performance of the MulVAL. Because it is quiet important to understand the graph and remove the paths which doesn’t have the weight for being successfully exploited.
LITERATURE ON PAST WORKS ON REDUCING ATTACK GRAPHS COMPLEXITY
The complexity of the attack graph is basically determined by three two important factors. Number of Hosts N (h), Number of identified vulnerabilities present in the NVD database Number of vulnerability N (v).
PROPOSED APPROACH –(RISK & CVSS BASE SCORE AS EVALUATION CRITERIA)
As it already has been discussed about the Nessus which is being used to perform the
vulnerability scans. The output of the scan can be extracted in multiple formats like Nessus dB, csv, html, pdf, Nessus. Since MulVAL and Nessus complement each other, MulVAL have utilities which supports and coverts the Nessus file formats to MulVAL readable files.
RESULT ANALYSIS OF USING NEW APPROACH
The attack graph generated was quite comprehensive in providing the information of the attacks. The graph is better than the previous generated attack graph based on the system generated report.
Every tool/software results definitely contains false positives, reports are to be thoroughly analyzed on the basis of vulnerability exploitable factors and then an attack graph generation would be something which has real worth in it.
REMEDIATION OF THE IDENTIFIED VULNERABILITIES
Every identified vulnerability was been fixed and there was a rescan performed. Following screen shots are the result of the same. Post applying filters the report has only one “critical -vulnerability” and it is identified only on a single host which falls into our filter. Yet it’s not vulnerability. It was been mentioned to be critical because Microsoft is no more supporting 2003.
BENEFITS AND CHALLENGES OF THIS NEW APPROACH
The complexity was drastically reduced when compared to past attack graph generated and the understanding levels were improved. Evaluating of potential data from the raw data clears lot of confusion and complexity. With the evaluated input to the MulVAL framework the graph generated will be precise according to the data provided.
CONCLUSION
This thesis is being presented as a study on reducing the complexity of attack graphs on realistic computer network environment. The aim to analyze the security of networks using attack graph concepts and reduce the complexity of attack graph.
The work was driven by two tools for attack graph generation MulVAL and for vulnerability scanner it is Nessus. After performing series of tests the graph generated by MulVAL does have problems in predicting real attacks.
The output of MulVAL shows graphs with complexity leaving decision maker’s job horrendous in filtering out the authentic information. Tests prove that the graphs generated need to be analyzed with utmost care. MulVAL can still predict attacks with better vision but requires evaluated and genuine input which directly helps us to generate eaningful graphs.
Hence evolution criteria based on parameters of the input should be done post vulnerability scanning and before loading the results into MulVAL framework for better and appropriate results. But few vulnerabilities like default passwords are ignored by MulVAL framework which can causeconcerns to security.
However this tool is little complex but provide good foundation for research work with respect to attack graph. One has to spend much time in filtering out the false positives. Otherwise it will lead to false predictions. Host access control lists and vulnerabilities are important things will work with MulVAL.
FUTURE SCOPE
The current attack graph technology haven’t been matured to give precise attack predictions but it is being used in SIEM (Security Information and event management) technology where this monitoring tool has the inbuilt attack patterns to identify the attacktree along with hosts associated in the attack tree and its vulnerabilities exploited.
Complete security industry is moving towards data analytics. Every organization is having
thousands of devices and these thousands will have hundreds of vulnerabilities computing and correlating and monitoring this data is becoming quiet next to impossible. Here specifically the companies are keenly looking into big data analytics and tableau which is data analytical tool and in view of the current situations as these tools will also produce visualizations for the processed data.
Yet we have tried for using tableau for the attack graph generations but we have faced problems while working on the X & Y axis coordinates. Would it can further work on this area to bring effective ways in predicting the attack paths.
Source: Charles Darwin university
Author: Tanvirali Musa