ABSTRACT
The aim of this paper is to analyze the array synthesis for 5 G massive MIMO systems in the line-of-sight working condition. The main result of the numerical investigation performed is that non-uniform arrays are the natural choice in this kind of application. In particular, by using non-equispaced arrays, we show that it is possible to achieve a better average condition number of the channel matrix and a significantly higher spectral efficiency.
Furthermore, we verify that increasing the array size is beneficial also for circular arrays, and we provide some useful rules-of-thumb for antenna array design for massive MIMO applications. These results are in contrast to the widely-accepted idea in the 5 G massive MIMO literature, in which the half-wavelength linear uniform array is universally adopted.
ANTENNAS AND PROPAGATION MODEL
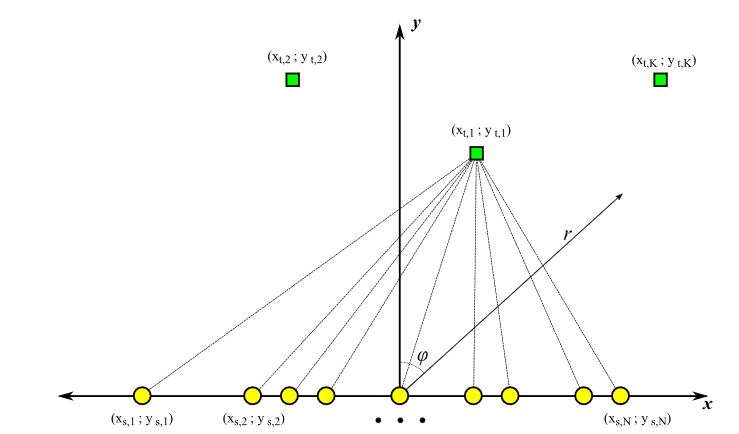
Figure 1. Massive MIMO system scenario. Circles: base station antennas; squares: terminals
In this paper, we will use a simplified model for antennas and propagation; in particular, we will consider isotropic radiating elements; we will neglect the effect of mutual coupling and polarization, and we will consider a simple 2D propagation model, i.e., BS antennas and user terminals will lie on the same plane. Furthermore, we will consider a fixed frequency f and the corresponding wavelength λ.
USER CORRELATION ANALYSIS
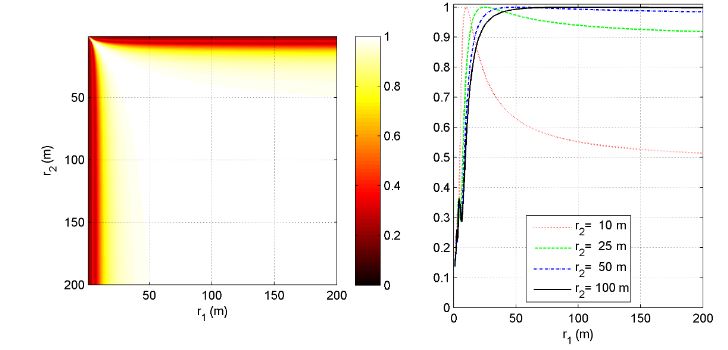
Figure 2. Two terminal correlation analysis for the λ / 2 equispaced array
Let us first consider the case of an equispaced array, with the inter-element distance d = λ / 2; in Figure 2, it is possible to see the case in which the two terminals are aligned along the y axis, and have only different distances (r1 and r2) from the BS. In the left subplot, we can see an image map representing the correlation coefficient of Equation (4) for variable r1 and r2, while in the right subplot, we can see the plot of the correlation coefficient for some fixed values of r2.
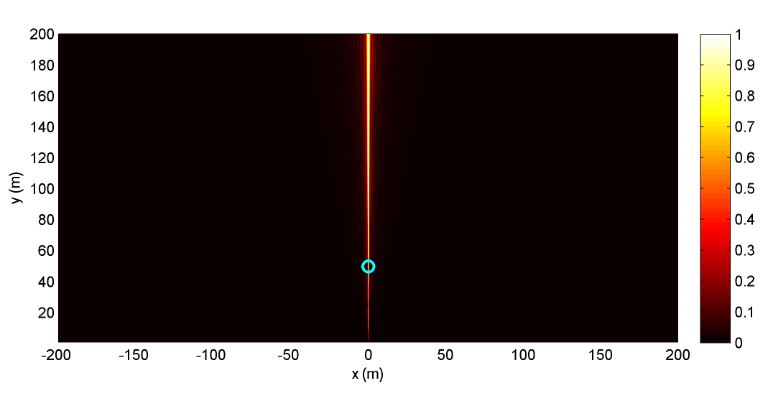
Figure 4. Image map of the correlation coefficient when the first terminal is fixed in the position marked with the circle and the second user is moved on the plane for the λ /2 equispaced array
The previous result has shown that the increase of the inter-element distance seems to have a beneficial effect on the capability of decorrelating users. To confirm this feature, let us see what happens if we consider the first terminal in a fixed position with respect to the array, and we move the second terminal on the xy plane. In Figure 4, we can see the case of a λ / 2 equispaced array: apart from an angular sector around the broadside direction of the array, the correlation is very low, thus confirming the very good results, in terms of favorable propagation, found by other researchers.
MULTI USER CHANNEL MATRIX
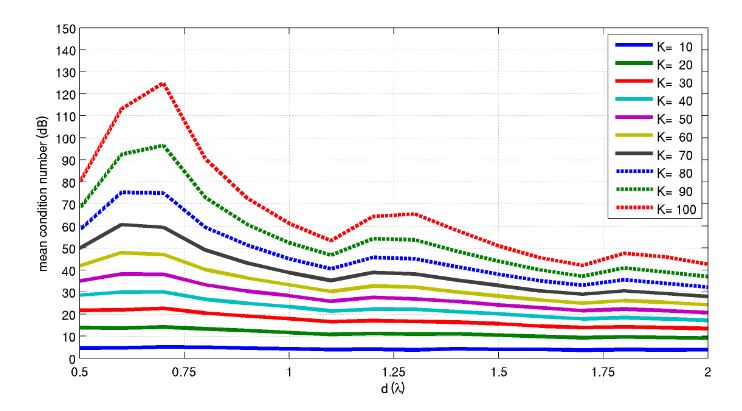
Figure 6. Mean condition number of the channel matrix as a function of the inter-element distance d and the number of users K
The number of grating lobes that affect the results is indeed an increasing discrete function of d, while the reduction of the beamwidth and the correlation among users sharing the same angle φ with respect to the BS are instead a continuous decreasing function of d. These two effects together contribute to the aforementioned oscillating/decreasing behavior seen in Figure 6.
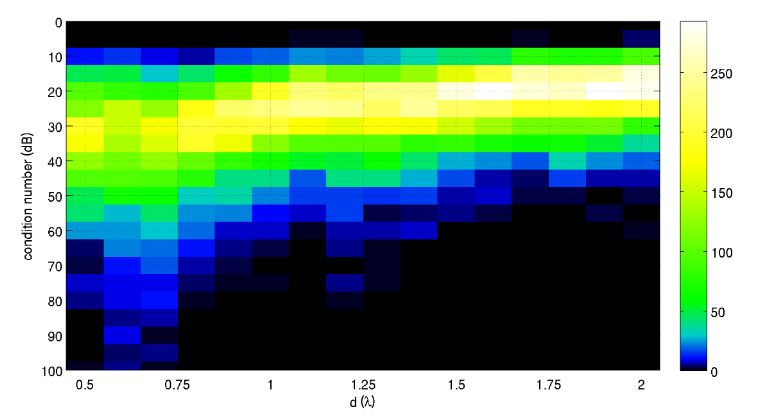
Figure 7. Distribution of the condition number as a function of the distance d for K = 50. Each column of the matrix in the image map is a histogram of the condition number
To get better insight into this result, let us focus on the case of K = 50 ; in Figure 7, we show the distribution of the condition number as a function of the distance d (each column of the matrix in the image map is a histogram of the condition number). The increase of d from λ/2 to 2 λ reduces the average value of the condition number of about 15 dB, and also, its spreading decreases.
EXPLOITING SPARSE ARRAYS
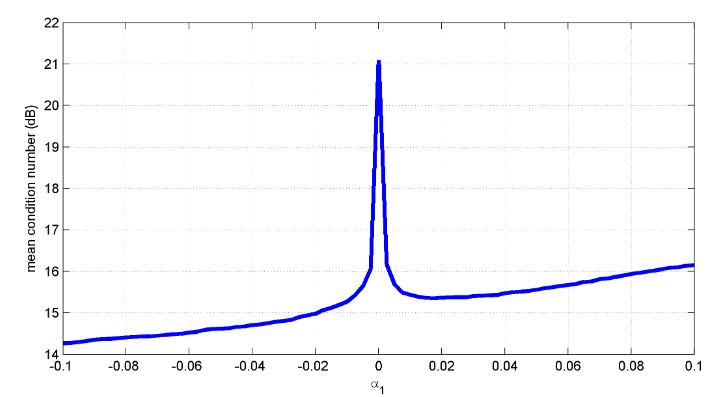
Figure 10. Average condition number as a function of α1 for a number of users K = 50 and d0 = 2 λ
Following the guidelines discussed before, we will consider now a parametric analysis of the performances, in terms of average condition number, on a set of 1000 configurations of K = 50 user terminals, as a function of α1. The result is depicted in Figure 10: apart from values very close to α1 = 0, corresponding to the equispaced array, we achieve a significant advantage in the mean condition number for both positive and negative values of α1 (with a slight advantage for the latter).
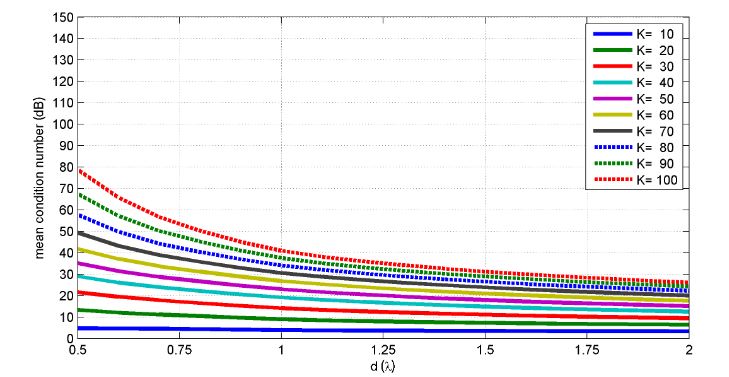
Figure 13. Mean condition number of the channel matrix as a function of the average inter-element distance d and the number of users K for a non-equispaced array with α1 = − 0.03
In Figure 13, we have instead depicted the effect of the non-linear spacing for a variable number of the average inter-element distance d and the number of users K : the oscillatory behavior of Figure 6 has now disappeared, and the condition number is now a monotonic function of the number of terminals and the average inter-element distance. The improvement with respect to the equispaced array is even more significant when the number of user terminals is higher.
CIRCULAR ARRAYS
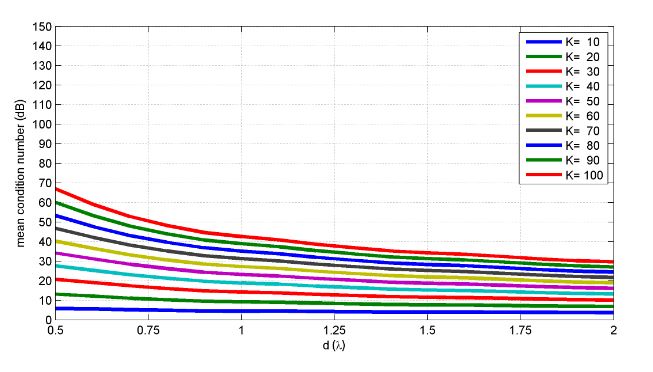
Figure 16. Mean condition number of the channel matrix as a function of the average inter-element distance d and the number of users K for a circular array
In Figure 16, we can see the average condition number that we can obtain for a variable inter-element distance d and a variable number of users K. This result confirms the importance of increasing the size of the antenna array as much as possible if we are interested in improving the conditioning of the channel matrix.
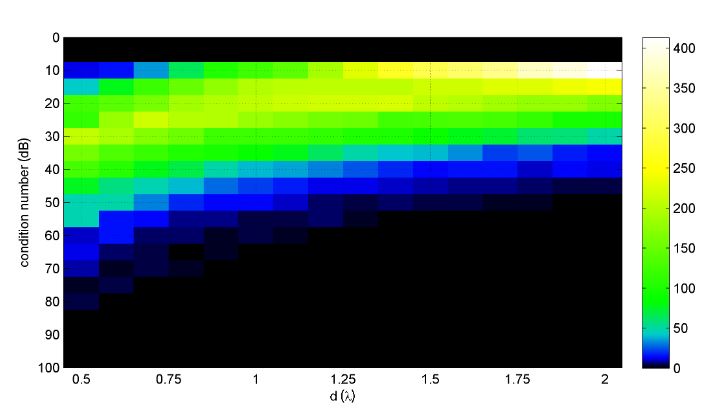
Figure 17. Distribution of the condition number as a function of the average distance d for the circular array with K = 50
In Figure 17, we instead depict the distribution of the condition number for a variable antenna distance d for the specific case K = 50; even in this case, it is surprising to see the behavior of the condition number that is very similar to the result depicted in Figure 14.
EVALUATING THE SPECTRAL EFFICIENCY
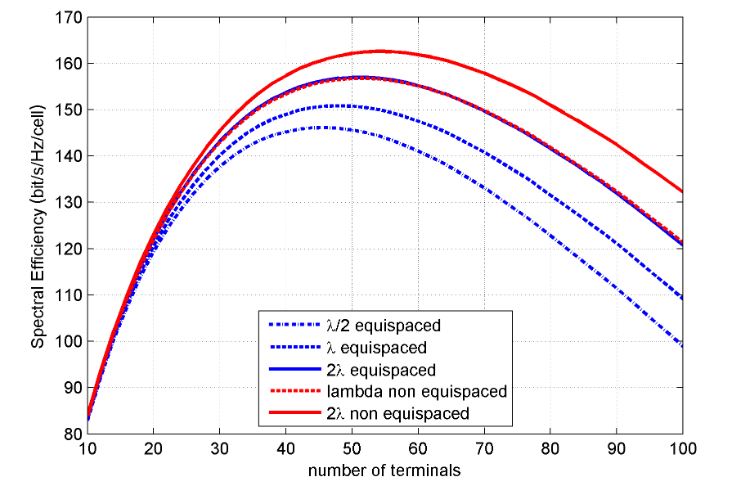
Figure 20. Average maximum achievable Zero Forcing (ZF) rate as a function of the number of user terminals K
In Figure 20, we compare the performances of the equispaced array, with inter-element distances (λ / 2, λ, 2 λ), with the performances of the non-equispaced array, calculated with a α1 = − 0.03 and average inter-element distance of (λ, 2λ); the SNR at the receiver is 5 dB.
SOME CONSIDERATIONS AND ANTENNA ARRAY DESIGN GUIDELINES
In this section, we would like to sum up some design consideration that can be inferred by the shown results. All of the simulations have been performed focusing on arrays with N = 200 radiating elements, but we have also performed other simulations, with a different number of radiators, confirming the advantages of sparse arrays for massive MIMO applications.
We have indeed chosen a very simple antenna model for the simulations (an array of isotropic elements without mutual coupling), but in the examples reported in the paper, the inter-element spacing is always larger than 0.5 wavelengths, and in some cases, it is much larger.
CONCLUSIONS
In this paper, we have discussed the impact of the array on the performances of a massive MIMO system. In particular, we have analyzed the LoS case, showing that increasing the size of the array can be very beneficial to the condition number of the MU-MIMO channel matrix: since the BS antenna is working in the near-field region of the array, a larger element distance allows one to exploit the spherical shape of the wavefronts.
We have also shown that using a non-equispaced array, we are able to further improve the resulting condition number, since by getting rid of the grating lobes, we are able to achieve a significant lowering of the average condition number also for small increases of the antenna array dimension. Such an improvement in the conditioning of the channel matrix results in an improvement in the spectral efficiency of the massive MIMO systems when using linear processing of the signals.
We have also analyzed the results achievable by means of circular arrays and a full circle coverage, finding results perfectly aligned with the ones of the non-equispaced linear array. It is worth underlining that all of the performed analyses have been done considering a fixed BS complexity. It is trivial to understand that with a proper sparse array design, we could reduce the number of antennas at the BS, achieving the same average conditioning of the channel matrix for a desired number of user terminals.
Source: University of Cassino
Authors: Daniele Pinchera | Marco Donald Migliore | Fulvio Schettino | Gaetano Panariello
>> Antenna Signal Processing Projects for Engineering Students
>> Projects on Antenna and Wave Propagation for Engineering Students