ABSTRACT
Changes in the gait characteristics, such as walking speed and stride length, of a person living at home can be used to presage cognitive decline, predict fall potential, monitor long-term changes in cognitive impairment, test drug regimens, and more. This thesis presents a novel approach to gait analysis in a smart-home environment by leveraging new advances in inexpensive sensors and embedded systems to create novel solutions for in-home gait analysis.
Using a simple, non-invasive hardware system consisting entirely of wall-mounted infrared and radio frequency sensor arrays, data is collected on the gait of subjects as they pass by. This data is then analyzed and sent to a clinician for further study. The system is non-invasive in that it does not use cameras and could be built into the molding of a home so that it would be nearly invisible. In a finished prototype version, the system presented in this thesis could be used to analyze the gait characteristics of one or more subjects living in a home environment while ignoring the data of visitors and other non-subject cohabitants.
The ability to constantly collect data from a home environment could provide thousands of observations per year for clinical analysis. Providing such a robust data set may allow people with gait impairment to live at home longer and more safely before transitioning to a care facility, have a reduced fall risk due to better prediction, and live a healthier life in old age.
DESIGN METHODOLOGY
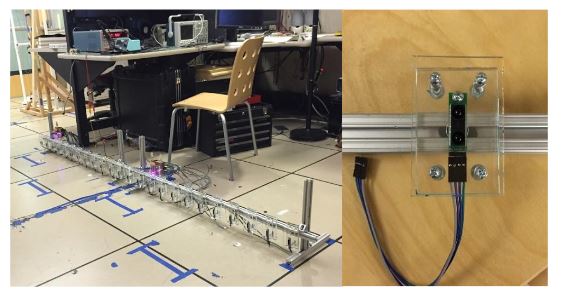
Figure 3: The second prototype of the IR sensor array
Figure 3: The second prototype of the IR sensor array. Left image depicts an array of 24 sensors in a simulated hallway setup in the BSP lab. Right is a detail showing the sensor in an acrylic housing attached to extruded aluminum rail.The system was tested following Institutional Review Board (IRB) protocols for the data collections. IRB oversight was provided by the OHSU IRB and was approved through the PSU IRB approval process.
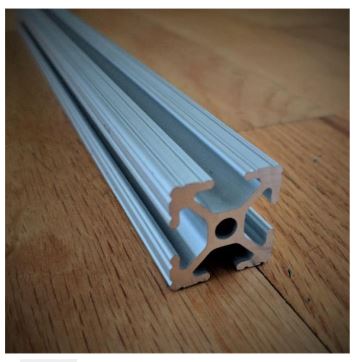
Figure 5: 80/20 1×1 inch extruded aluminum railing
The benefit of mounting to a single wall is that in a hallway with doors or objects along one side the sensor system would still be able to be used. In addition the sensor system need only be powered by a single outlet instead of by one outlet for the transmitter array and a second for the receiver array on the opposite side of the hallway.
A rail was constructed in two 4ft segments, each on a pair of legs which could be adjusted in height. The rail itself is made of aluminum extrusion called 80/20. The extrusion rail system consists of modular extruded aluminum which can be cut and bolted to itself easily (Figure 5). The continuous channel in the rail allows the height and placement of sensors to be infinitely adjustable. To connect the sensor to the rail a box is constructed of three Plexiglas sheets as well as bolts and nylon washers.
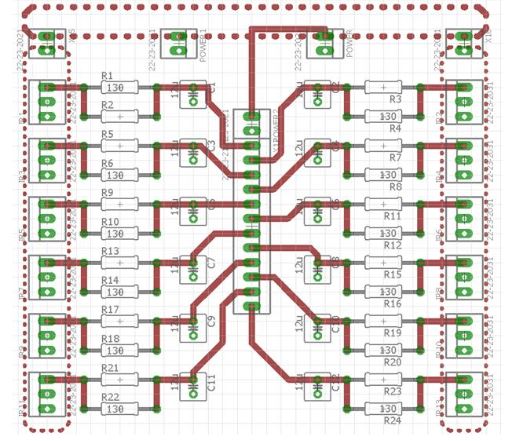
Figure 6: Control Circuit Board.12 IR sensors attachment points with shunt circuits entering a single line female pin set where a daughter board is attached carrying a MUX
It is important to sample the sensors multiple times per 60Hz cycle and find the average of multiple values to account for noise in individual samples. Because there are 24 sensors, only 12 channels of each multiplexer are used. The outputs of the MUX as well as that of the 4bit counters are taken as inputs to an analog to digital converter (ADC) which samples at a rate of 64 kHz, allowing it to capture the MUX signals with 8 samples per switch as well, again to account for noise in switching.
A Scientific Instruments ADC was used which is capable of sampling 8 channels at up to 250 kHz. Power is provided to the sensor system by a dedicated DC power supply running at 5v 1A. The control circuit was implemented on a custom routed PCB which was designed using EagleCAD with the help of John Folsom at MotioSens and cut on the LID PCB router (Figure 6). In the board schematic mounting points can be seen for a shunt circuit which is a capacitor bridging the power and ground line for each sensor. The shunt circuit in general has many uses as a circuit breaker, reverse polarity protection, or low pass filter.
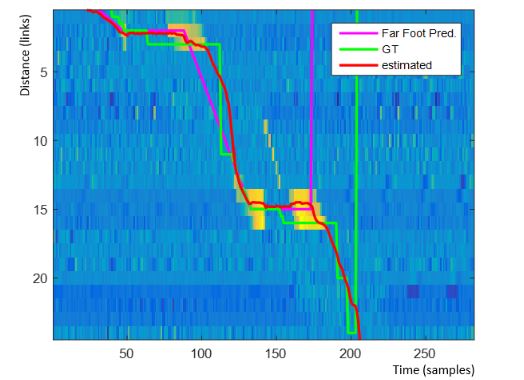
Figure 11: An example of far foot print or information (purple) overlaid on silhouette-cancelled data. Also pictured: tracked foot (red), ground truth (green)
Figure 11 shows the far foot prediction (purple), the background and far foot data (heat map), the tracked foot position (red), and the labeled foot position (green). By using a strong prior concept of the far foots position two things can be done. The first is that switching model can be constructed and the second is that a second prior can be folded into the system at the measurement model.
RESULTS AND DISCUSSION
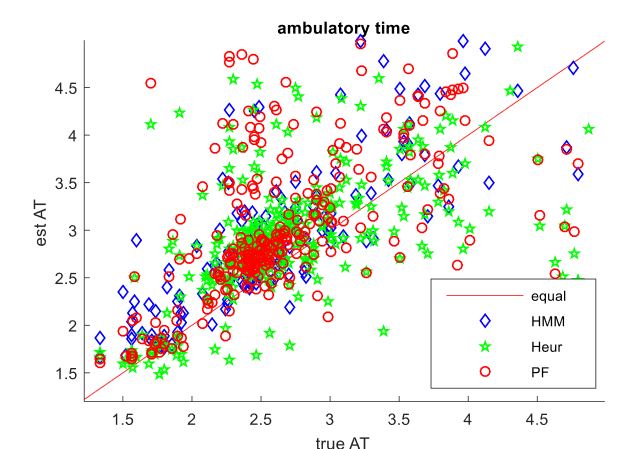
Figure 12: Scatter plot of Walking Speed (WS). True WS (as determined by GR mat) is on the x-axis, while estimated is on y-axis. Thus, the closer to the diagonal (red) line the better
Development of the Hidden Markov Model was based upon code written by Dr.Anindya Paul for MotioSens. The code was adapted by Erich Schafermeyer. The discrete state space of transition probabilities was designed by Erich Schafermeyer and Dr.Eric Wan and the emission probabilities were based on a measurement model designed by Fatema Adenwala.
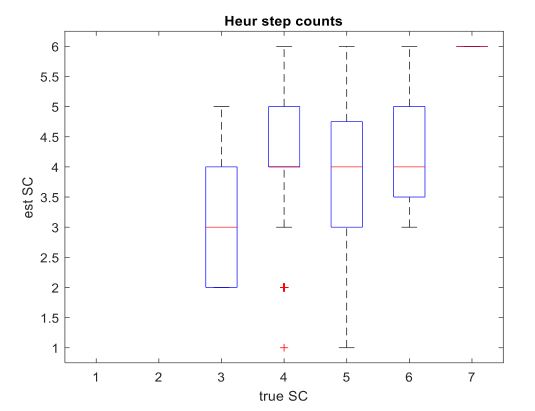
Figure 14: boxplot of step count (SC) for the heuristic algorithm. The x-axis depicts the true SC based on GAITRite mat. The y-axis depicts the estimated step count
Each box plot is a distribution of estimated step counts as calculated by the titular method for that true step count. For example, in Figure 14 the 1 st columnar box plot depicts walks with 3 steps. The heuristic method measured step counts between 2 and 5 steps for these walks. The median step count was 3, the 1 st quartile is 2, and the 4 th quartile is 4. The 2 nd columnar boxplot depicts walks with 4 steps, and so on. For the heuristic method the mode of estimated values are equal to the true value for 3 and 4 steps, thereafter the algorithm has trouble distinguishing walks with more than 4 steps. This, again, reinforces the intuition derived from the WS and AT estimates that fewer steps (equivalent to faster walking) is easier for the system to detect.
SUBJECT IDENTIFICATION USING IR AND RF FINGERPRINTING
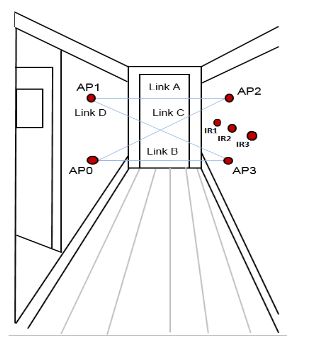
Figure 22: Access-points (AP) transceivers are arranged in a hallway
Figure 22: Access-points (AP) transceivers are arranged in a hallway. As a person walks past, the RSS disruptions between links are measured and used to recognize the person. IR sensors provide timing information to extract walking speed.The system used in this research consists of 4 radio frequency (RF) transceivers operating in the 900M Hz range at a 20Hz sample rate (Figure 22). The receivers each sample a received signal strength (RSS) value which indicates how strong the signal being transmitted is upon reception. Changes in RSS are caused by objects in the room absorbing, reflecting, and blocking the signal energy. Humans, furniture, and walls can all contribute to RSS values.
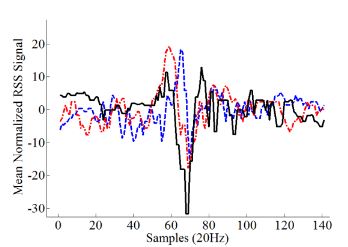
Figure 23: Example RSS waveforms for three different subjects
An example of a single waveform for each subject is given in (Figure 23). In parallel a set of 3 infrared (IR) sensors provide a walking speed and trigger which alerts the system to a subject walking through. Because the IR triggers are at waist height (approximately 1m from the ground) the trigger also negates the issue of a pet 74 triggering the subject identification system. When the system is triggered a marker is placed at that point in the RF data such that it can be used to identify which subject is walking past. The physical sensors are less than one inch square and can be housed in unobtrusive plastic enclosures to be minimally invasive to a home-living environment.
CONCLUSION AND FUTURE WORK
The gait analysis sub system presented in this thesis is capable of tracking and analyzing gait metrics for multiple subjects living in a smart-home environment. It can measure step length with a RMSE of 9.05cm, walking speed with a RMSE of 22.16 cm/s, and single leg standing time with a 157ms RMSE. A direct comparison of the three gait analysis algorithms–HMM, heuristic, and APF–shows that the auxiliary particle filter is the most effective at extracting analyzable foot positions for gait metric extraction in all cases but the ambulatory time and walking speed metrics.
In those cases the heuristic method is the most effective. A future prototype of the analysis system could include a heuristic walking speed analysis method and an APF-based approach for the remaining gait metrics. It is possible that with the next hardware prototype a higher SNR will be achieved. If a higher SNR is achieved, testing with varying SNR levels of synthetic data suggest that the APF tracking could be greatly enhanced to track more states such as step width and instantaneous foot velocity as well as to track more accurately, lowering the RMSE for the gait metrics.
A higher SNR could enable a greatly simplified workflow consisting of one particle filter with a more detailed process model which could potentially be used without the need for data association or a second particle filter. If a higher SNR is not achieved through better hardware improved data association techniques and a true interacting mixture model, or joint probabilistic data association (JPDAF), could be used. JPDAF is a tool used in computer vision for tracking an unknown number of targets which may interact of be obscured in a scene.
Source: Portland State University
Author: Erich Reinhardt Schafermeyer
>> More B.Com Computer Application Projects